Data study · evidence before decisions
How much income goes to gross rent?
An ACS 2024 snapshot across 386 metropolitan areas in the 50 states and District of Columbia. The 30% and 50% thresholds describe renter-occupied units with a computable gross-rent-to-income ratio. Units outside that denominator stay visible.
By Ahmadreza Samadi · Source snapshot checked 17 October 2026
What does this study measure?
It calculates the share of renter-occupied units whose Census-tabulated gross rent is at least 30% or at least 50% of household income, among units for which that ratio can be computed. Gross rent includes contract rent and separately renter-paid utilities and fuels. The 50% group is part of the 30% group; the two shares must not be added.
This is a descriptive survey snapshot. It does not establish an individual household's full budget, a property's yield, a future rent, a causal explanation or an investment recommendation.
A view of ten large renter populations
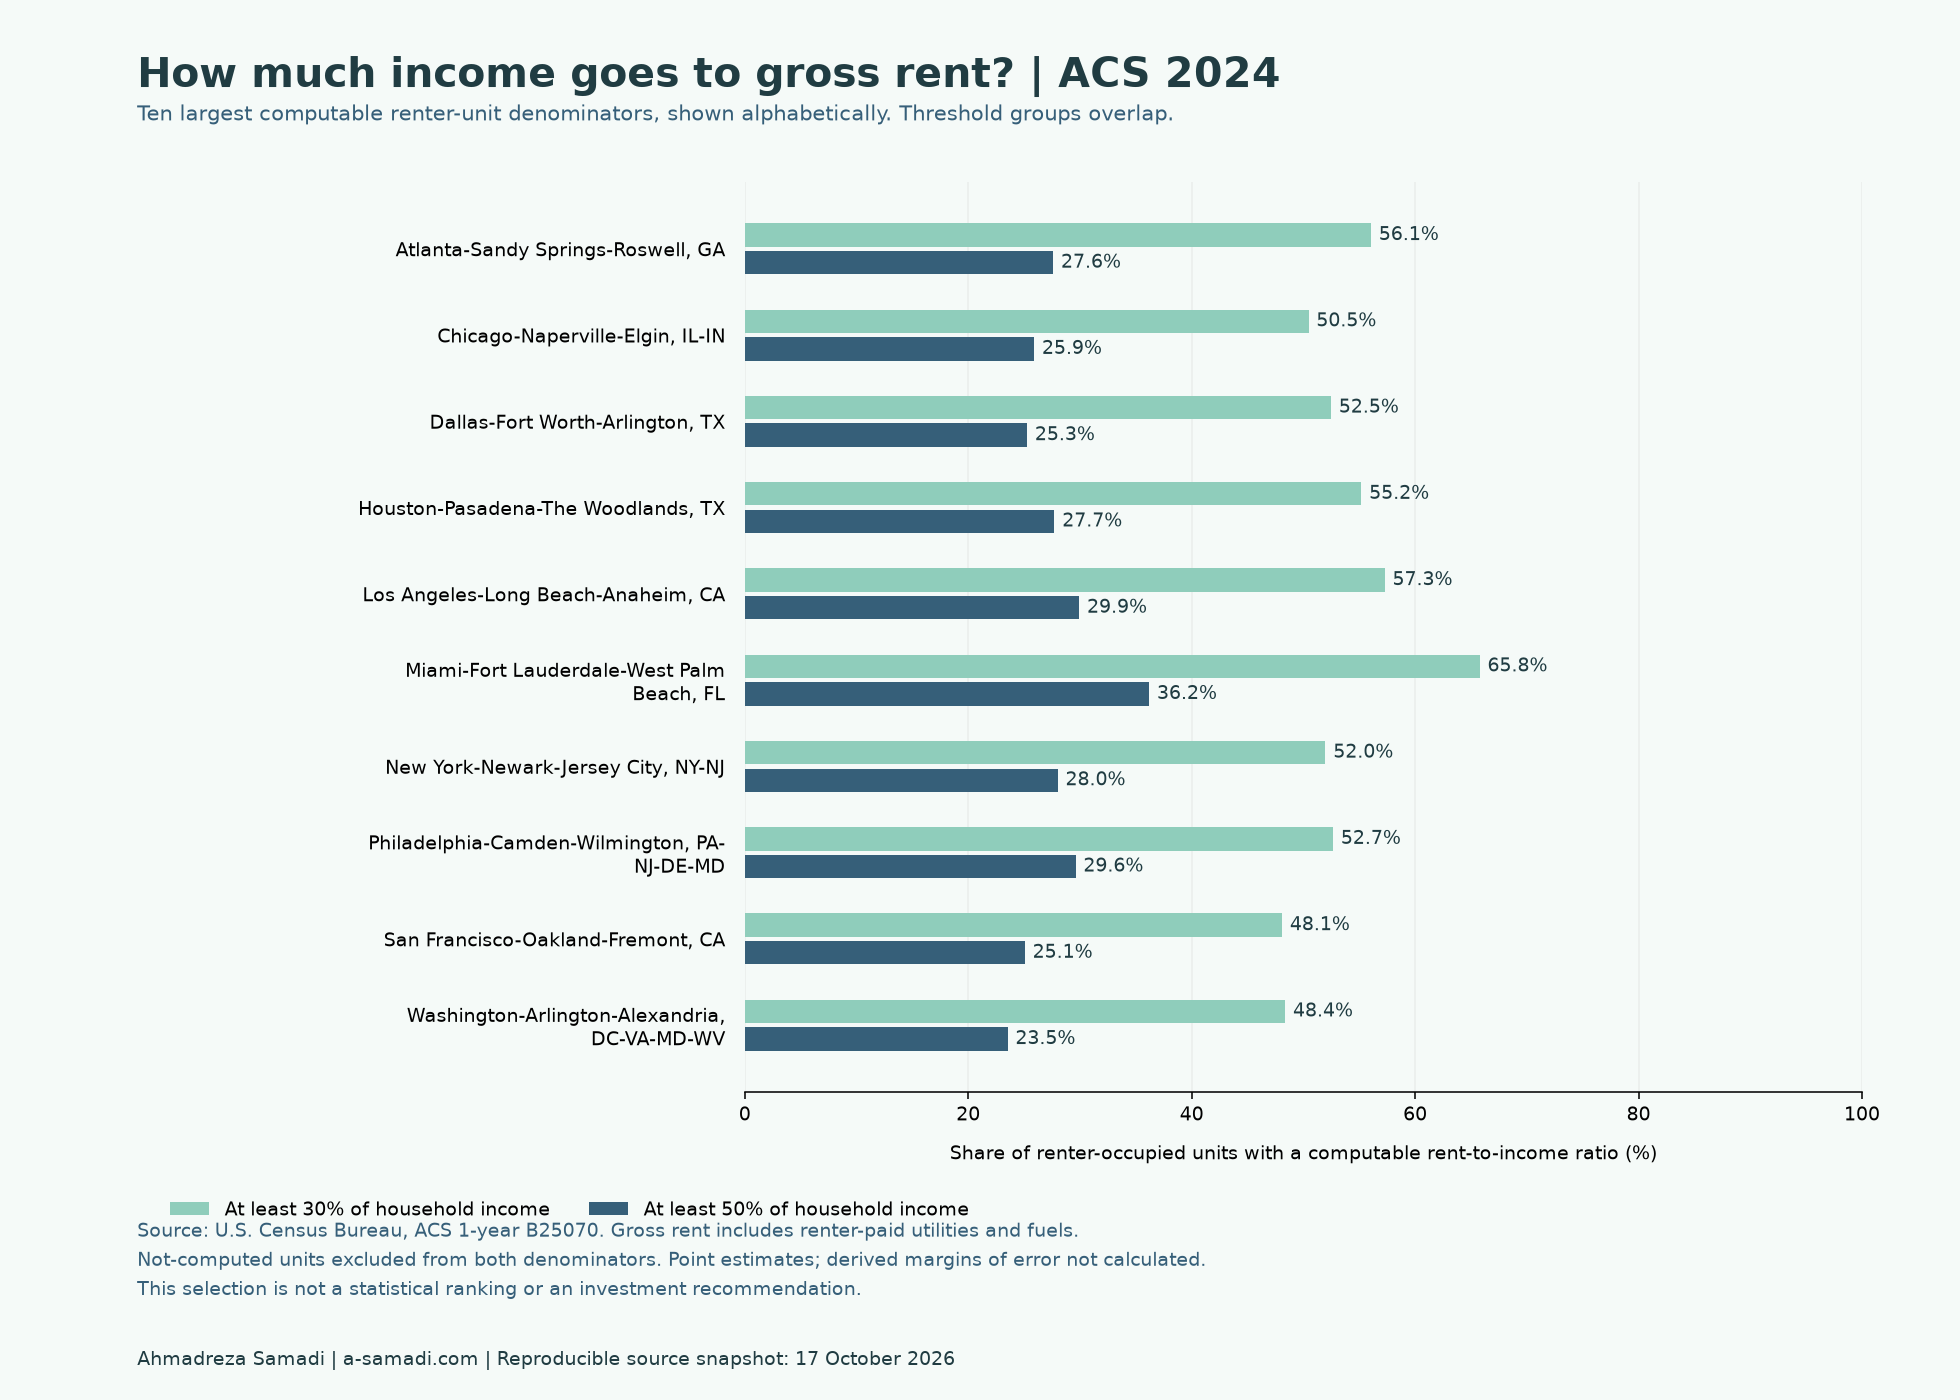
| Metropolitan area | At least 30% | At least 50% | Computable units | Not-computed units |
|---|---|---|---|---|
| Atlanta-Sandy Springs-Roswell, GA Metro Area | 56.1% | 27.6% | 753,229 | 39,708 |
| Chicago-Naperville-Elgin, IL-IN Metro Area | 50.5% | 25.9% | 1,186,977 | 73,227 |
| Dallas-Fort Worth-Arlington, TX Metro Area | 52.5% | 25.3% | 1,148,755 | 55,843 |
| Houston-Pasadena-The Woodlands, TX Metro Area | 55.2% | 27.7% | 1,022,843 | 63,683 |
| Los Angeles-Long Beach-Anaheim, CA Metro Area | 57.3% | 29.9% | 2,264,762 | 108,540 |
| Miami-Fort Lauderdale-West Palm Beach, FL Metro Area | 65.8% | 36.2% | 882,414 | 51,124 |
| New York-Newark-Jersey City, NY-NJ Metro Area | 52.0% | 28.0% | 3,465,378 | 188,268 |
| Philadelphia-Camden-Wilmington, PA-NJ-DE-MD Metro Area | 52.7% | 29.6% | 783,376 | 46,721 |
| San Francisco-Oakland-Fremont, CA Metro Area | 48.1% | 25.1% | 757,749 | 37,929 |
| Washington-Arlington-Alexandria, DC-VA-MD-WV Metro Area | 48.4% | 23.5% | 843,539 | 40,790 |
Download all 386 metros as CSV · Download chart as SVG · Complete chart alt text
Download the Excel companion (XLSX) for the same ACS 2024 snapshot, with a filterable table and formulas. Read the workbook instructions and limits. Native Microsoft Excel execution and interactive sorting have not been tested.
Before reusing the CSV, read the 35-column field guide or the custom JSON dictionary. Both describe this ACS 2024 snapshot, including percentage denominators, missing values and source estimate/margin-of-error pairs. This documentation companion is newer than the version 1.1.1 release archive; it adds no observations.
Need a short explanation before using the data? Download the plain-text reading card for the two study questions, count versus percentage uncertainty, and missing-value limits. The ownership scenarios and rent-burden estimates remain separate datasets.
Prefer to search the CSV locally? The offline lookup kit includes the same fixed data, dictionary and Python helper. Unzip everything and follow START-HERE.txt; Python 3.12 or newer is required, with no extra packages or account. This download is separate from the v1.1.1 analysis archive and adds no observations or derived percentage uncertainty.
Who is in the denominator?
The table's universe is renter-occupied housing units. Its “Not computed” category includes units where no rent is paid and households reporting no income or a net loss. Excluding that category from a ratio does not establish that those households have low costs or no affordability difficulty.
For each published whole metropolitan area:
- Computable denominator = total renter-occupied units minus not-computed units.
- At least 30% numerator = the 30.0–34.9, 35.0–39.9, 40.0–49.9 and 50.0-or-more percentage bins.
- At least 50% numerator = the 50.0-or-more bin.
- Each share = 100 × its numerator divided by the computable denominator.
B25070: denominator=E001−E011;30%+numerator=E007+E008+E009+E010;50%+numerator=E010.
The CSV also reports not-computed units as a share of all renter-occupied units. A zero denominator produces an unavailable percentage; missing or sentinel estimates are not converted to zero. The cutoffs refer to the published rounded ratio bins, not a new calculation from household microdata.
A fictional denominator check
Imagine 100 renter-occupied units: 20 are not computed, 40 are in the at-least 30% bins and 10 are in the at-least 50% bin. The denominator is 80. The two shares are 50% and 12.5%. Dividing 40 by 100 would instead produce 40%, answering a different question. These are invented teaching counts, not a metro's data.
Why 386 metros?
The pipeline joins official ACS 1-year table B25070 to its matching geography labels by exact GEO_ID. It selects whole metropolitan statistical areas at summary level 310 and component 00, retaining cross-state areas once. It excludes 140 published micropolitan rows and 6 Puerto Rico metropolitan rows from this 50 states/DC scope. All excluded CBSA rows and reasons are retained.
The 1-year product does not publish every small geography. No missing metro is filled with 5-year estimates. This is a different source universe from the earlier HUD rent/ownership study; the number of rows should not be forced to match it.
What should a reader keep uncertain?
- Sampling uncertainty. ACS figures are estimates. All 11 published estimate/MOE pairs are preserved in the CSV. Derived percentage MOEs are not calculated; this page does not rank statistical differences.
- Time. The data year is 2024. Rent and household income have different ACS measurement windows. This is not a live asking-rent feed or a forecast.
- Households outside the ratio. Not-computed units remain visible, rather than being called zero burden.
- Individual decisions. A metropolitan share does not assess a particular apartment, household, loan or property return.
As checked 17 October 2026, the official 2025 ACS 1-year release is announced for 29 October 2026. No 2025 values are used here. The source date and availability will be checked at that announced release, with the saved 2024 snapshot retained for reproducibility.
Can someone reproduce the chart?
Yes, from the public aggregate Census files. The download and build scripts preserve versioned raw inputs, exact source URLs and SHA-256 hashes. The analysis build uses Python's standard library; plotting additionally uses the pinned Matplotlib version. The analysis pipeline passed 17 tests, covering arithmetic and source-snapshot integrity, and a separate agent independently checked ten metro rows against raw source counts. This is not a human or Census certification.
Method and denominator · Citation metadata (version 1.1.1) · Raw source URLs and hashes
Original analysis code is MIT. Input federal statistics retain their source status: Census employee-created data generally are not copyright-protected within the United States, with foreign-country and third-party exceptions. No worldwide CC0 dedication or Census endorsement is claimed. Code and aggregate source data are available in the version 1.1.1 GitHub release.
Primary sources
- Census ACS table-based summary files; exact 2024 B25070 and geography-file URLs are retained in the source record.
- 2024 ACS 1-year table B25070, including its renter-occupied-unit universe.
- 2024 ACS subject definitions, printed pages 19–20: gross rent and rent-to-income ratio.
- 2025 release notice, checked 17 October 2026.
- Census DS027 public-access policy, printed page 9: reuse limits.
Start with the next decision
Before reusing a rent-burden headline, record which units it describes, which units it excludes, the survey vintage and what the uncertainty allows you to say. If the question is about one property, collect property-specific evidence instead of substituting a metropolitan percentage.
Why rent divided by home value is not property yield · Property-specific cash-flow worksheet · AI in real estate reading path
Dates, columns and reuse
The observations are ACS 2024 one-year estimates. They are not 2026 asking rents. Source estimate/MOE pairs are retained; derived percentage MOEs have not been calculated.
CSV column dictionary (35 distinct fields)
geo_id- Exact GEO_ID from the source geography file; keep as text, including its geography-vintage marker. Unit: identifier.
cbsa_code- Five-character CBSA code from the source geography file; preserve text and leading zeros. Unit: identifier.
metro_name- Published whole metropolitan-area label, not a property or city-only boundary. Unit: label.
survey_year- ACS 1-year source year, not download year or current market year. Unit: year.
status- Analysis availability status. This fixed released snapshot contains only ok. The builder can also report unavailable source estimate or zero computable denominator. Unit: status.
renter_units_total- Total renter-occupied housing units; not a count of people or only cash-rent units. Unit: housing units.
not_computed_units- Units for which the source ratio is not computed; retained separately, not treated as zero burden. Unit: housing units.
computable_units- Denominator for the two threshold percentages. Unit: housing units.
rent_30plus_units- Units in the published 30.0%-or-more bins. Unit: housing units.
rent_50plus_units- Units in the published 50.0%-or-more bin; a subset of rent_30plus_units. Unit: housing units.
rent_30plus_pct- Share of computable units at 30.0% or more, rounded to six decimals; not a 0–1 fraction. Unit: percent (0–100).
rent_50plus_pct- Share of computable units at 50.0% or more; nested inside the 30% group. Do not add these percentages. Unit: percent (0–100).
not_computed_pct_all_renters- Share of all renter-occupied units with a not-computed ratio; its denominator differs from the two burden percentages. Unit: percent (0–100).
B25070_E001- Published estimate. Source token retained; a sentinel is not a valid count and never becomes zero. Unit: housing units.
B25070_M001- Published margin of error for the matching estimate; not the error of a derived percentage. Source token retained; a sentinel is not a valid count and never becomes zero. Unit: housing units.
B25070_E002- Published estimate. Source token retained; a sentinel is not a valid count and never becomes zero. Unit: housing units.
B25070_M002- Published margin of error for the matching estimate; not the error of a derived percentage. Source token retained; a sentinel is not a valid count and never becomes zero. Unit: housing units.
B25070_E003- Published estimate. Source token retained; a sentinel is not a valid count and never becomes zero. Unit: housing units.
B25070_M003- Published margin of error for the matching estimate; not the error of a derived percentage. Source token retained; a sentinel is not a valid count and never becomes zero. Unit: housing units.
B25070_E004- Published estimate. Source token retained; a sentinel is not a valid count and never becomes zero. Unit: housing units.
B25070_M004- Published margin of error for the matching estimate; not the error of a derived percentage. Source token retained; a sentinel is not a valid count and never becomes zero. Unit: housing units.
B25070_E005- Published estimate. Source token retained; a sentinel is not a valid count and never becomes zero. Unit: housing units.
B25070_M005- Published margin of error for the matching estimate; not the error of a derived percentage. Source token retained; a sentinel is not a valid count and never becomes zero. Unit: housing units.
B25070_E006- Published estimate. Source token retained; a sentinel is not a valid count and never becomes zero. Unit: housing units.
B25070_M006- Published margin of error for the matching estimate; not the error of a derived percentage. Source token retained; a sentinel is not a valid count and never becomes zero. Unit: housing units.
B25070_E007- Published estimate. Source token retained; a sentinel is not a valid count and never becomes zero. Unit: housing units.
B25070_M007- Published margin of error for the matching estimate; not the error of a derived percentage. Source token retained; a sentinel is not a valid count and never becomes zero. Unit: housing units.
B25070_E008- Published estimate. Source token retained; a sentinel is not a valid count and never becomes zero. Unit: housing units.
B25070_M008- Published margin of error for the matching estimate; not the error of a derived percentage. Source token retained; a sentinel is not a valid count and never becomes zero. Unit: housing units.
B25070_E009- Published estimate. Source token retained; a sentinel is not a valid count and never becomes zero. Unit: housing units.
B25070_M009- Published margin of error for the matching estimate; not the error of a derived percentage. Source token retained; a sentinel is not a valid count and never becomes zero. Unit: housing units.
B25070_E010- Published estimate. Source token retained; a sentinel is not a valid count and never becomes zero. Unit: housing units.
B25070_M010- Published margin of error for the matching estimate; not the error of a derived percentage. Source token retained; a sentinel is not a valid count and never becomes zero. Unit: housing units.
B25070_E011- Published estimate. Source token retained; a sentinel is not a valid count and never becomes zero. Unit: housing units.
B25070_M011- Published margin of error for the matching estimate; not the error of a derived percentage. Source token retained; a sentinel is not a valid count and never becomes zero. Unit: housing units.
Reuse and citation
Original study explanations and analytical selection/arrangement are shared under CC BY 4.0, to the extent Ahmadreza Samadi holds copyright or similar rights. Credit the author, link the licence and indicate changes. Underlying government data and documents retain their source status and exceptions; this does not relicense them or restrict public-domain facts. Existing code/dictionary licences, font notices, portraits and marks retain their own terms. Earlier grants are not withdrawn.
Source notices: Census DS027, page 9. These sources do not endorse this analysis.
Suggested citation: Ahmadreza Samadi (2026-10-17). Metro rent burden: reproducible ACS 2024 point estimates. Software/method version 1.1.1. https://a-samadi.com/studies/rent-burden/
About the author
Dubai-based technology entrepreneur Ahmadreza Samadi is Co-Founder & Technical Lead of Appraiva, building AI real estate intelligence, and Co-Founder & CEO of Royal Abraj Group.
Part of Property Decision Data
AI assisted the analysis pipeline, drafting and source comparison. No customer outcome, personal transaction, performed company experiment or native-language review is claimed.